Successful trading isn’t just about luck—it’s about making informed decisions. One of the most widely used methods to analyze financial markets is technicalanalysis. By studying past price movements, chart patterns, and market indicators, traders aim to forecast future price action. For beginners, technicalanalysis may seem overwhelming, but with the right approach, it becomes a powerful tool to improve your trading strategy.
What Is Technical Analysis?
Technical analysis is the study of historical price and volume data to predict potential future movements. Unlike fundamental analysis, which looks at a company’s financial health, technicalanalysis focuses purely on market behavior.
It is based on three key assumptions:
- Price discounts everything: Market price reflects all available information.
- Prices move in trends: Markets often follow upward, downward, or sideways trends.
- History repeats itself: Chart patterns and trader psychology tend to repeat over time.
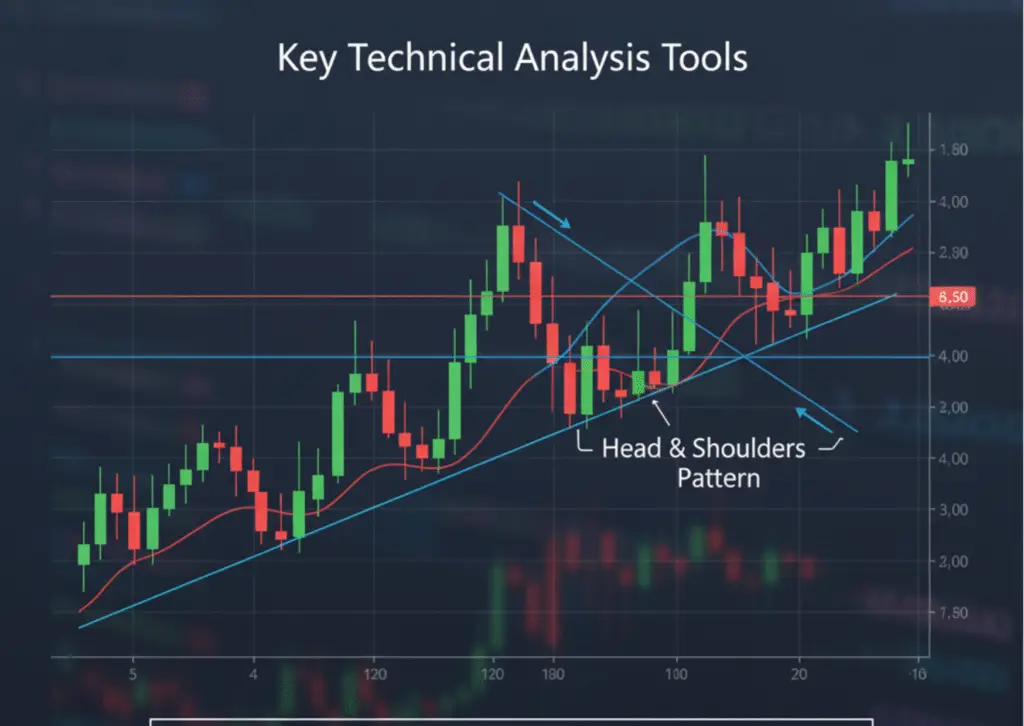
Key Tools of Technical Analysis
1. Charts
- Line Chart: Simple view of price trends.
- Candlestick Chart: Shows detailed price action and sentiment.
- Bar Chart: Displays open, high, low, and close for each period.
2. Indicators & Oscillators
- Moving Averages (MA): Smooths out price data to identify trends.
- Relative Strength Index (RSI): Measures momentum; shows if a stock is overbought or oversold.
- MACD (Moving Average Convergence Divergence): Helps spot trend reversals.
- Bollinger Bands: Indicates volatility and potential breakouts.
3. Chart Patterns
- Head & Shoulders: Signals potential trend reversal.
- Double Top/Bottom: Indicates strong reversal levels.
- Triangles & Flags: Show continuation or consolidation phases.
4. Support & Resistance
- Support: A price level where buying interest prevents further decline.
- Resistance: A price level where selling pressure prevents further rise.
Why Traders Use Technical Analysis
- Helps in identifying entry and exit points.
- Useful for short-term trading (intraday, swing trading).
- Complements other methods like options trading and risk management.
- Offers insights into market psychology and sentiment.
Limitations of Technical Analysis
- No method is 100% accurate—false signals happen.
- Works best when combined with risk management strategies.
- Can be subjective—two traders may interpret the same chart differently.
Conclusion
Technical analysis is a skill that grows with practice. By learning to read charts, apply indicators, and recognize patterns, you can turn raw market data into actionable insights. Whether you’re a stock trader, futures investor, or options enthusiast, technicalanalysis equips you with the tools to navigate markets confidently.
👉 Ready to master charting and technicalanalysis? Join NiveshpathShala and learn from experts with real market experience.