In the world of trading and investing, decisions are often driven by two main approaches: fundamental analysis and technical analysis. While fundamental analysis focuses on a company’s financial health, technical analysis examines historical data—price movements, volume, and chart patterns—to predict future trends. Traders and investors worldwide use technical analysis to time their entries and exits more effectively.
What Is Technical Analysis?
Technical analysis is the study of past market data, primarily price and volume, to forecast future price behavior. The underlying belief is that market trends often repeat themselves due to human psychology and market behavior. By identifying patterns and signals, traders aim to capitalize on these price movements.
Key Tools of Technical Analysis
- Charts and Patterns
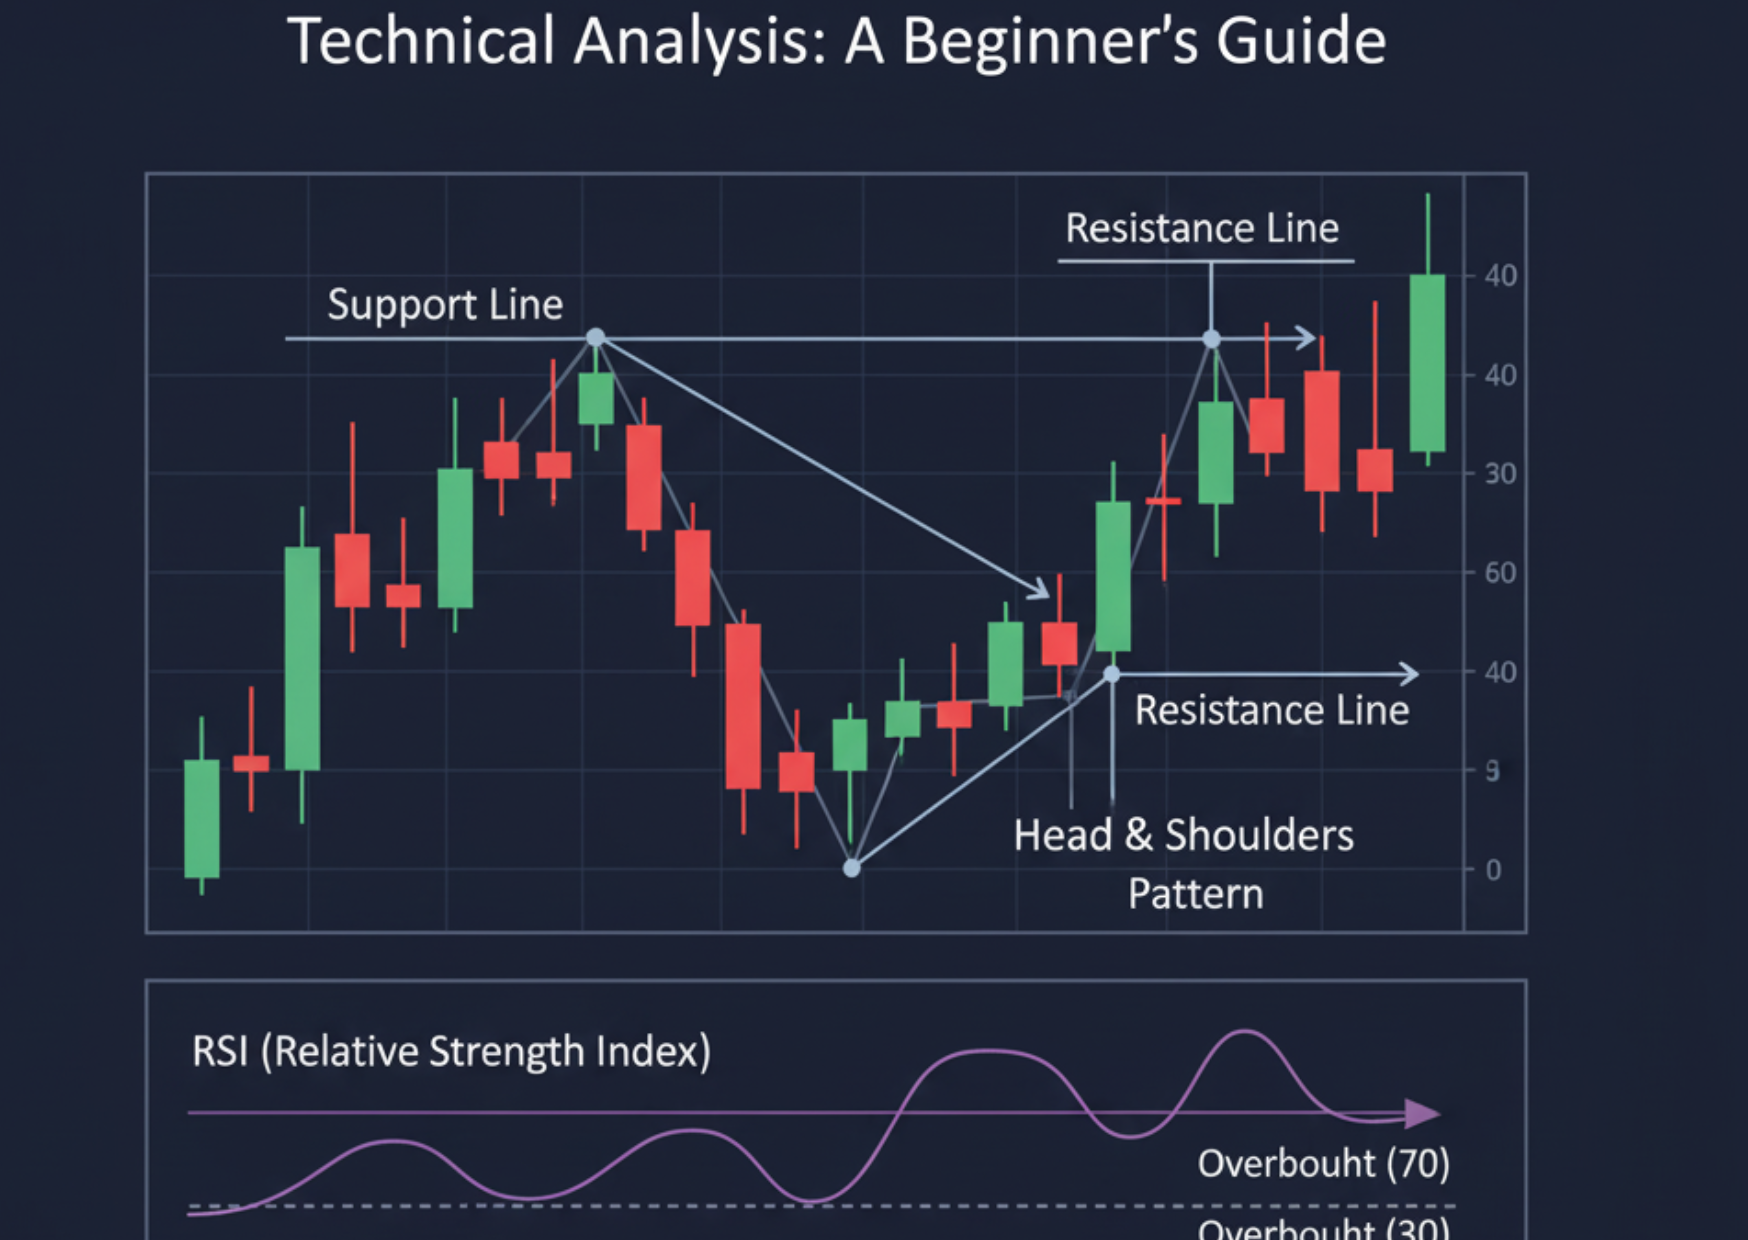
- Line charts, bar charts, and candlestick charts are used to visualize stock movements.
- Patterns like head-and-shoulders, double tops, and triangles provide insights into trend reversals or continuations.
- Support and Resistance Levels
- Support is the price level where demand tends to prevent further decline.
- Resistance is the level where selling pressure stops the price from rising.
- Recognizing these levels helps traders plan entry and exit points.
- Technical Indicators
- Moving Averages (MA): Smooth out price data to identify trends.
- Relative Strength Index (RSI): Measures momentum to show overbought or oversold conditions.
- MACD (Moving Average Convergence Divergence): Signals trend changes and momentum shifts.
- Volume Analysis
Volume shows the strength of a price move. High volume often confirms a strong trend, while low volume may indicate weakness.
Benefits of Technical Analysis
- Provides timing signals for buying and selling.
- Helps identify short-term and long-term trends.
- Can be applied across multiple markets—stocks, forex, commodities, and crypto.
- Complements fundamental analysis for a holistic investment strategy.
Common Mistakes to Avoid
- Relying on just one indicator without cross-checking.
- Ignoring market news or fundamentals entirely.
- Overcomplicating analysis with too many tools.
- Trading emotionally instead of sticking to signals.
Conclusion
Technical analysis is a powerful tool that helps traders and investors make data-driven decisions. By studying historical price movements, patterns, and indicators, you can better anticipate market trends and improve your trading success. While it doesn’t guarantee profits, combining technical analysis with discipline and risk management significantly increases your chances of success.
👉 At NiveshPathshala, we offer hands-on courses on technical analysis to help you understand charts, indicators, and strategies. Learn how to analyze markets like a pro and trade with confidence.