Charting is one of the most essential skills for traders and investors. Financial charts give you a clear visual picture of how a stock or asset has moved over time. By learning to read these charts, you can identify trends, spot opportunities, and make more informed decisions—whether you’re trading stocks, futures, or options.
Types of Financial Charts
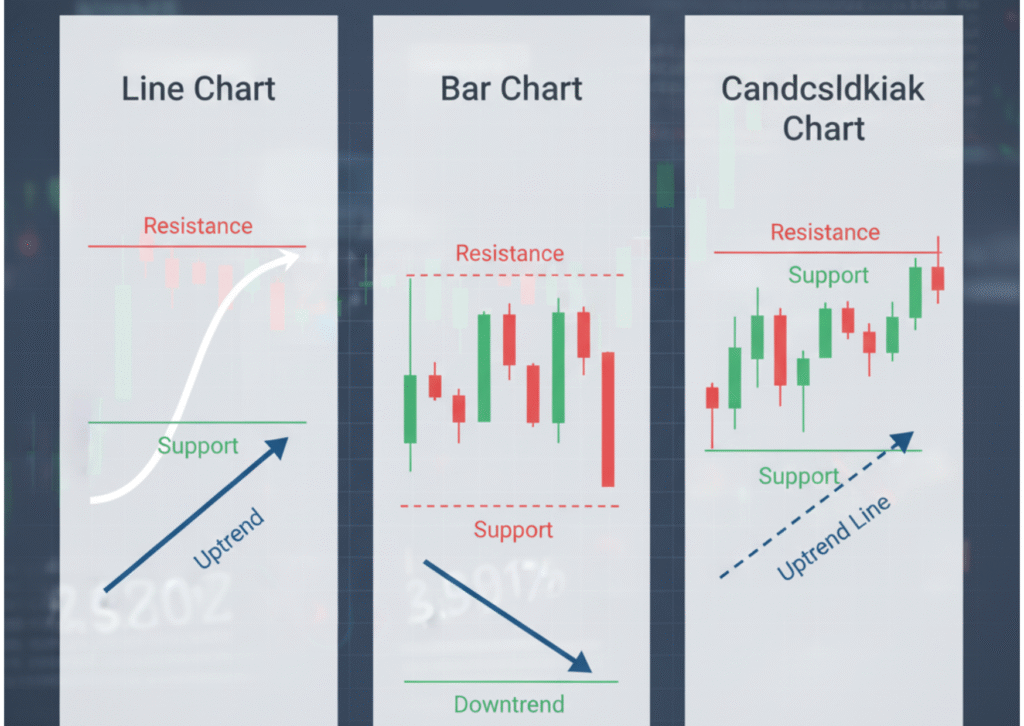
1. Line Chart
- Simplest form of charting.
- Shows closing prices over time.
- Best for identifying long-term market trends.
2. Bar Chart (OHLC Chart)
- Displays Open, High, Low, and Close for each time period.
- Provides more detail on price movement.
- Helps traders see daily volatility.
3. Candlestick Chart
- Most popular among traders.
- Each “candle” shows open, high, low, and close.
- Color-coded: typically green (bullish) and red (bearish).
- Useful for spotting patterns like Doji, Hammer, and Engulfing.
Key Elements in Chart Analysis
- Trend: Is the market moving up (bullish), down (bearish), or sideways (consolidation)?
- Support & Resistance: Price levels where a stock repeatedly bounces or struggles to break.
- Volume: Indicates the strength behind a price move. High volume often signals stronger trends.
- Indicators: Tools like Moving Averages, RSI (Relative Strength Index), and MACD help confirm momentum and predict reversals.
Why Charting Matters in Trading
- Helps identify the best entry and exit points.
- Provides insights into market psychology.
- Allows traders to combine price action with indicators for higher accuracy.
- Especially important in options trading, where time-sensitive moves matter.
Conclusion
Charting is more than just looking at price movements—it’s about interpreting patterns, trends, and signals to make smarter investment decisions. Start simple with line and candlestick charts, then gradually add indicators as you gain confidence. With practice, charting can become your most valuable trading tool.
👉 Want to learn charting with hands-on guidance? Join Niveshpath Shala and start reading the markets like a pro.